
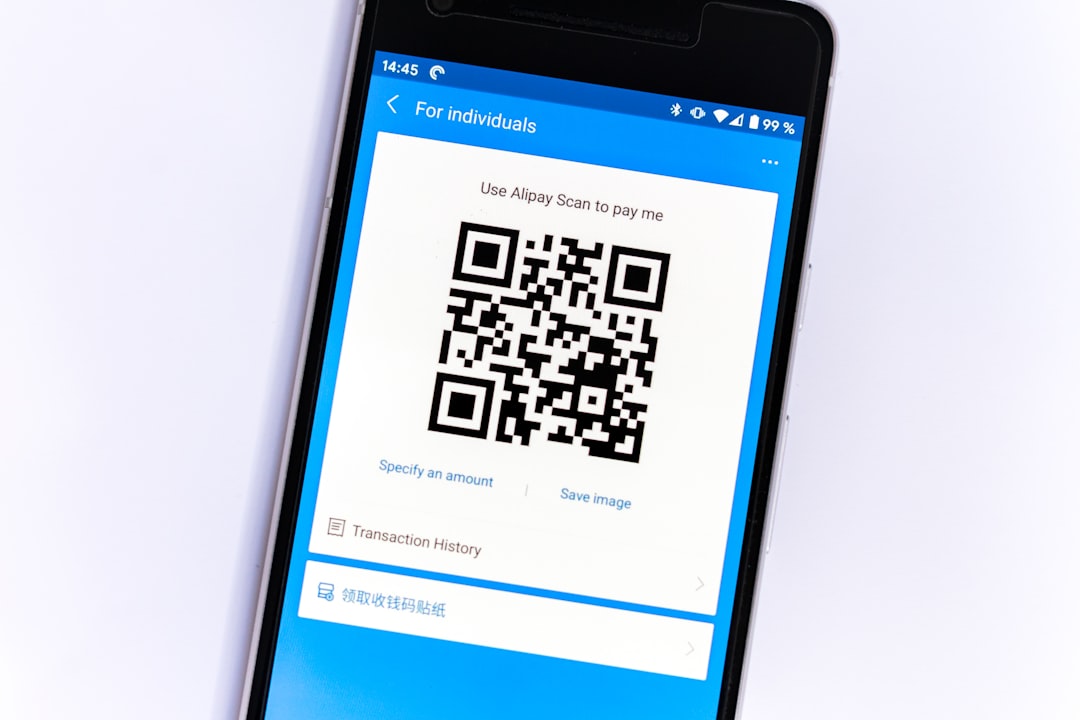
QR codes are now a practical bridge between offline attention and online measurement. They appear on packaging, posters, brochures, receipts, event signage, business cards, and product displays, but their value depends on whether you can measure what happens after someone scans them. Google Analytics 4, commonly called GA4, can help you track QR code performance when the QR code points to a properly tagged URL or a controlled redirect.
TLDR: To track a QR code in Google Analytics, create a destination URL with UTM parameters, generate a QR code from that URL, and monitor the traffic in GA4 acquisition reports. Use unique UTM values for each campaign, location, or printed asset so you can identify which QR codes are driving visits and conversions. For more control, send scans through a redirect URL before forwarding users to the final page. Always test the QR code before publishing it.
Table of Contents
Why QR Code Tracking Matters
A QR code by itself is not automatically trackable in Google Analytics. It is essentially a shortcut to a URL. When a user scans the code, their phone opens the encoded link, and Google Analytics records the visit only if that link leads to a website or landing page where GA4 is installed.
This distinction is important. Google Analytics does not measure the physical scan directly unless the scan results in a web session or a custom event sent to GA4. In most marketing situations, the correct approach is to make the QR code point to a URL that includes campaign tracking parameters. This allows GA4 to identify the traffic source and attribute engagement or conversions to that specific QR code campaign.
For serious reporting, QR code tracking helps answer questions such as:
- Which printed materials generated the most traffic?
- Did in-store signage perform better than packaging inserts?
- Which event booth or location drove the highest engagement?
- Did QR code visitors complete a form, make a purchase, or download a file?
- Is an offline campaign producing measurable online results?
Understanding the Tracking Method
The most reliable way to track QR code traffic in Google Analytics is to use UTM parameters. These are tags added to the end of a URL that tell analytics platforms where the visit came from and which campaign it belongs to.
A standard tracked URL may look like this:
https://www.example.com/landing-page?utm_source=qr&utm_medium=print&utm_campaign=spring_launch
When someone scans a QR code containing that URL, GA4 can classify the visit based on the UTM values. The user still lands on the intended page, but the analytics data includes campaign context.
The most common UTM parameters are:
- utm_source: Identifies where the traffic came from, such as qr, poster, flyer, or product packaging.
- utm_medium: Identifies the marketing medium, such as print, offline, event, or direct mail.
- utm_campaign: Identifies the campaign name, such as summer sale, conference 2026, or new product launch.
- utm_content: Differentiates variations, such as front poster, table card, or north entrance sign.
- utm_term: Less common for QR codes, but sometimes used for additional segmentation.
Step 1: Decide What You Want to Measure
Before generating a QR code, define the purpose of the campaign. Tracking should not be an afterthought. A print advertisement, product label, restaurant menu, event badge, or instruction card may all need different measurement logic.
Start by identifying the primary goal. For example, you may want visitors to:
- Visit a product page.
- Register for an event.
- Claim a discount.
- Download a brochure.
- Complete a lead form.
- Watch a video.
- Contact your sales team.
This goal should determine the landing page and the conversion event you monitor in GA4. If the QR code leads to a generic homepage, reporting will usually be weaker. A dedicated landing page gives you cleaner data and makes it easier to evaluate performance.
Step 2: Create a Tagged URL
Once you know the destination, create a URL with UTM parameters. Use a consistent naming structure because inconsistent UTM naming is one of the most common causes of poor reporting. For instance, Print, print, and printed may appear as separate values in reports, which makes analysis harder.
A strong naming convention might look like this:
- utm_source=qr
- utm_medium=offline
- utm_campaign=annual_report_2026
- utm_content=back_cover
That would create a URL similar to:
https://www.example.com/report?utm_source=qr&utm_medium=offline&utm_campaign=annual_report_2026&utm_content=back_cover
If you are placing QR codes on several assets for the same campaign, vary the utm_content value. For example, you might use lobby poster, brochure page 3, and receipt footer. This allows you to compare exact placements rather than only reviewing the campaign as a whole.
Step 3: Generate the QR Code
After creating the tagged URL, use it as the destination when generating your QR code. The QR code should encode the full URL, including all UTM parameters.
At this stage, accuracy is essential. A small typo in a parameter or destination URL can compromise the entire campaign. Before printing, scan the QR code with multiple devices and confirm that it:
- Opens the correct landing page.
- Preserves the full UTM-tagged URL in the browser.
- Loads quickly on mobile networks.
- Displays a mobile-friendly page.
- Triggers the expected GA4 session or event.
For printed campaigns, consider using a dynamic QR code or a redirect URL when appropriate. A static QR code permanently contains one fixed URL. If the destination changes later, the printed code cannot be edited. A dynamic QR code or redirect structure gives you more flexibility because the visible printed code can remain the same while the final destination is updated.
Step 4: Verify Tracking in GA4
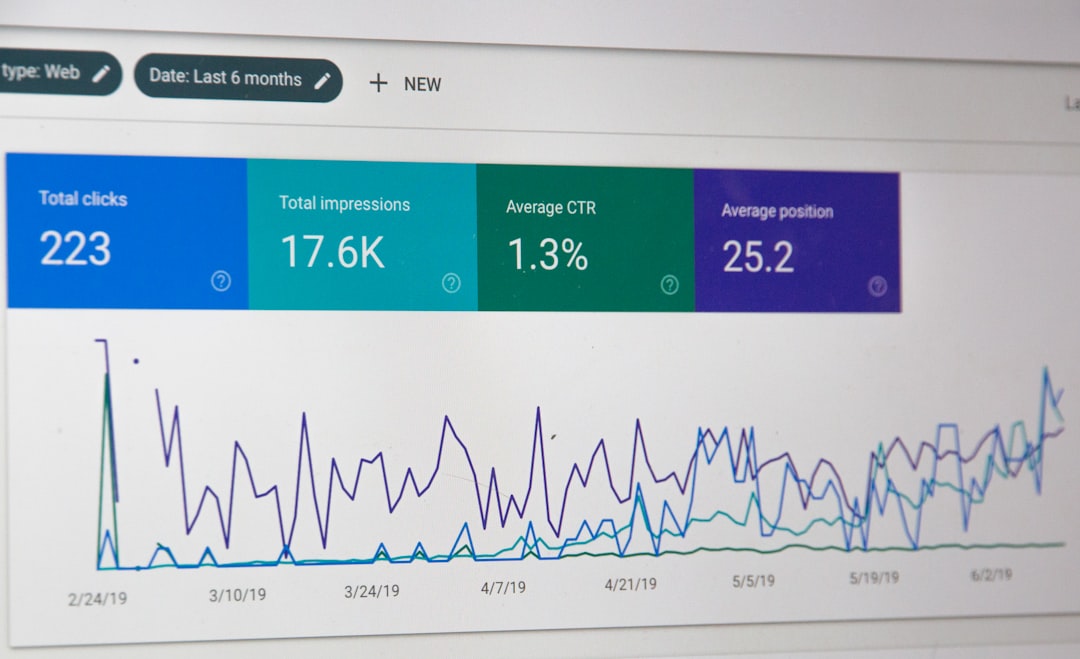
After scanning the QR code yourself, open Google Analytics 4 and check whether the visit appears. For immediate validation, use the Realtime report. This can show active users, page views, and traffic information shortly after the scan.
To review campaign data in GA4, go to:
- Reports
- Acquisition
- Traffic acquisition
From there, look for dimensions such as Session source / medium or Session campaign. If your UTM values were set correctly, you should see traffic associated with values like qr / offline or your chosen campaign name.
You can also use Explore reports in GA4 for deeper analysis. Explorations allow you to build custom tables that include campaign, source, medium, landing page, device category, conversions, and other useful fields.
Step 5: Track Conversions, Not Just Visits
Counting QR code visits is useful, but it is usually not enough. A campaign can generate many scans and still fail to produce business value. For serious analysis, connect QR code traffic to meaningful conversions.
Examples of GA4 conversions for QR code campaigns include:
- Form submissions.
- Purchases.
- Newsletter signups.
- Account registrations.
- File downloads.
- Video plays.
- Appointment bookings.
- Clicks on phone number or email links.
In GA4, conversions are based on key events. Make sure the relevant event is being collected and marked as a key event. For example, if your landing page includes a lead form, confirm that successful form submissions trigger a GA4 event such as generate_lead or a custom event name that your team understands.
This is where QR code reporting becomes much more valuable. Instead of saying, “This poster received 500 visits,” you can say, “This poster generated 500 visits, 42 form submissions, and a 8.4% lead conversion rate.”
Using Redirects for Better Control
A redirect URL can improve management and tracking, especially for long-term or high-value campaigns. Instead of encoding the final landing page directly in the QR code, you encode a shorter controlled URL such as:
https://www.example.com/qr/spring
That URL then redirects to the final UTM-tagged destination. This setup gives you several advantages:
- You can change the final destination without reprinting the QR code.
- You can keep the printed QR code simpler and cleaner.
- You can maintain a central record of QR code destinations.
- You can apply server-side logging if needed.
- You can reduce the risk of broken printed campaigns.
However, redirects must be implemented carefully. Use a proper redirect status and test that UTM parameters are preserved. If the redirect strips tracking parameters or sends users through multiple unnecessary hops, GA4 data may become less reliable and user experience may suffer.
Creating Separate QR Codes for Different Placements
If the same QR code is used everywhere, GA4 will show total campaign traffic but will not tell you which placement performed best. For better attribution, create separate tracked URLs for each major placement.
For example:
- Poster:
utm_content=poster - Brochure:
utm_content=brochure - Product packaging:
utm_content=packaging - Event booth:
utm_content=booth
This level of detail is especially useful when budget decisions depend on performance. If one placement consistently delivers higher conversion rates, you can invest more confidently in that channel.
Common Mistakes to Avoid
QR code tracking is straightforward, but small mistakes can create unreliable data. Avoid these common problems:
- Using an untagged URL: Without UTM parameters or another tracking method, QR traffic may appear as direct traffic or be difficult to identify.
- Sending users to a desktop-only page: Most QR scans happen on mobile devices, so the landing page must be mobile-friendly.
- Reusing one code for every placement: This limits your ability to compare performance.
- Changing UTM naming conventions: Inconsistent capitalization and wording can fragment campaign data.
- Not testing before printing: Printed errors can be expensive and sometimes impossible to correct.
- Tracking only scans or visits: Without conversion tracking, you may overvalue traffic that does not produce results.
- Using overly long URLs without testing: Long encoded URLs can create dense QR codes that are harder to scan, especially when printed small.
Best Practices for Reliable QR Code Analytics
To make your reporting more trustworthy, document every QR code you create. Maintain a simple tracking sheet with the campaign name, final URL, UTM parameters, print location, launch date, owner, and status. This becomes valuable when campaigns overlap or when multiple teams create codes.
Use dedicated landing pages when possible. A targeted landing page improves user experience and makes reporting clearer. It also allows you to tailor the message to the context in which the scan occurred, such as an event, store visit, catalog, or product package.
Keep the QR code visible, large enough to scan, and placed where users have time and reason to interact with it. Analytics can tell you what happened after the scan, but strong placement and clear calls to action determine whether scans happen in the first place.
Finally, review results at appropriate intervals. For a short event, daily monitoring may be necessary. For packaging or printed materials distributed over months, weekly or monthly analysis may be more suitable. Always interpret QR code performance in context, considering distribution volume, placement quality, audience intent, and seasonality.
Conclusion
Tracking QR codes in Google Analytics is not complicated, but it requires disciplined setup. The essential process is to create a UTM-tagged URL, generate a QR code from that URL, test it thoroughly, and then review the results in GA4 acquisition and conversion reports. For more advanced control, use redirect URLs and separate tracking links for different placements.
When implemented properly, QR code tracking turns offline engagement into measurable digital insight. It helps you move beyond assumptions and evaluate which printed assets, locations, and campaigns are actually driving meaningful outcomes. For any organization that uses QR codes in marketing, operations, events, or product communication, this level of measurement is no longer optional; it is a basic requirement for accountable decision-making.