
For digital teams, product pages are no longer static landing destinations. They are measurable business assets that must prove how well they attract visitors, explain value, support purchase decisions, and generate revenue. Twindo.ai product pages can be strengthened through analytics, reporting, and dashboard features that help teams understand performance with clarity, discipline, and repeatable insight.
TLDR: Twindo.ai product pages should be managed with a clear analytics model that tracks traffic, engagement, conversion, and revenue impact. For example, if a product page receives 20,000 monthly visits and improves its conversion rate from 2.4% to 3.1%, that can mean 140 additional conversions per month. A reliable dashboard helps marketing, product, and sales teams see what changed, why it matters, and what action should come next. The strongest reporting setup combines high-level KPIs with page-level diagnostics.
Table of Contents
Why Analytics Matter for Product Pages
A product page often carries significant responsibility. It introduces the offer, answers objections, builds trust, and directs the customer toward an action such as requesting a demo, starting a trial, booking a call, or completing a purchase. Without analytics, teams are left to judge performance by assumptions rather than evidence.
For Twindo.ai product pages, analytics should provide a structured picture of how users move through the page. This includes where visitors come from, how long they stay, what sections they engage with, and whether they complete the intended goal. When these signals are collected consistently, they help teams make decisions based on observed behavior rather than internal preference.

Core Metrics to Track
A trustworthy reporting system begins with the right metrics. Too many dashboards become overloaded with data that looks impressive but does not guide action. A practical Twindo.ai product page dashboard should focus on a smaller group of meaningful indicators.
- Page visits: Total traffic shows the reach of the product page and helps evaluate campaign performance.
- Traffic source: Organic search, paid campaigns, referrals, email, and direct traffic often behave differently and should be measured separately.
- Engagement rate: Scroll depth, section views, video plays, and clicks reveal whether visitors are consuming the page content.
- Conversion rate: The percentage of visitors who complete the desired action is one of the most important performance measures.
- CTA performance: Clicks on buttons such as Start Free Trial, Request Demo, or Contact Sales show how compelling the page journey is.
- Drop off points: Identifying where users leave the page can highlight unclear messaging, weak proof points, or technical friction.
- Revenue influenced: For sales-led or ecommerce flows, connecting page visits to pipeline or purchases provides stronger business context.
Dashboard Features That Support Better Decisions
A dashboard should not simply display numbers. It should organize information so that stakeholders can quickly understand status, trend, and priority. For Twindo.ai product pages, a strong dashboard experience should separate strategic performance from operational detail.
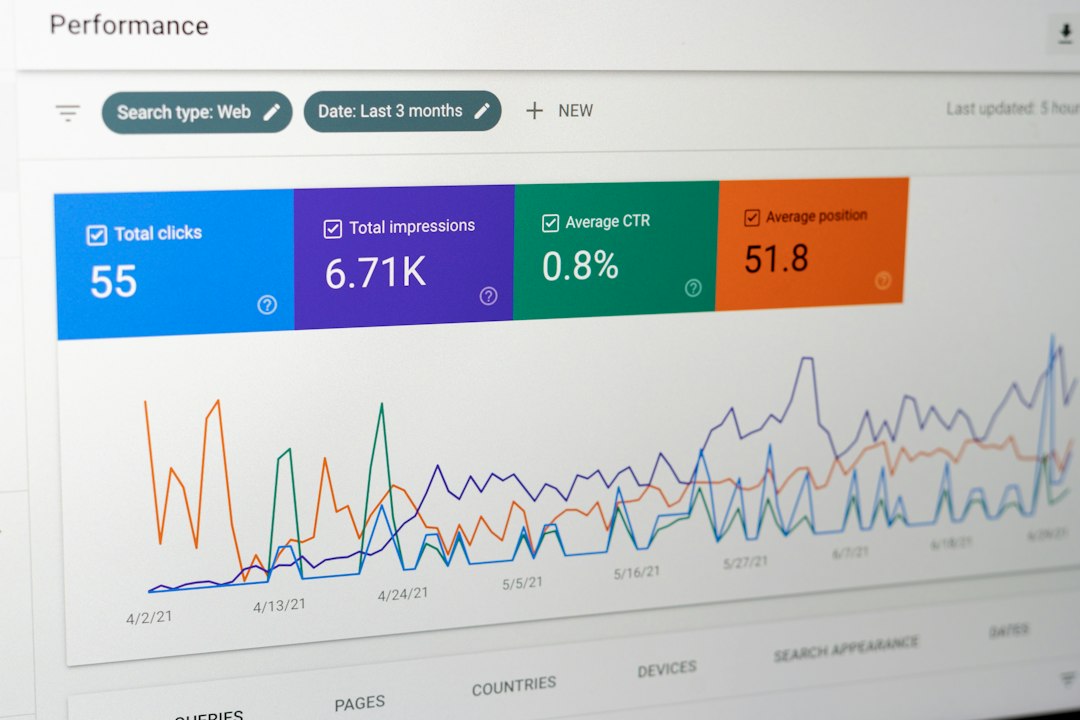
At the executive level, the dashboard may show total visits, qualified conversions, conversion rate, and revenue contribution. At the marketing level, it may compare traffic channels, campaign performance, and content engagement. At the product or UX level, it may show scroll depth, click density, form abandonment, and device-specific behavior.
Useful dashboard features include:
- Real time visibility: Teams can monitor campaign launches, traffic spikes, and unusual behavior as they happen.
- Date range comparison: Comparing this month with last month or this quarter with the previous quarter makes trends easier to interpret.
- Segment filters: Users can isolate performance by country, device, source, campaign, account type, or visitor status.
- Goal tracking: Dashboards should connect page interaction to meaningful outcomes, not just surface activity.
- Alerting: Automated notifications can flag sudden drops in conversion rate, broken funnels, or unexpected traffic changes.
Reporting for Marketing and Growth Teams
Marketing teams need reports that clarify which channels are delivering quality traffic. A paid campaign may drive a large number of visitors, but if those visitors leave quickly and do not click the primary CTA, the campaign may need adjustment. Conversely, a smaller organic search segment may generate higher intent and stronger conversion outcomes.
Reporting should therefore include both volume and quality. A serious Twindo.ai product page report might show that organic visitors convert at 4.2%, while paid social visitors convert at 1.6%. This does not automatically mean paid social is failing, but it does indicate that message alignment, audience targeting, or landing page variation should be reviewed.
Reports should also help teams understand content performance. If visitors consistently scroll to the pricing section but rarely continue to the demo form, the issue may involve pricing clarity or perceived value. If many users click customer proof points, testimonials and case studies may deserve more prominent placement.
Reporting for Product and UX Teams
Product and user experience teams benefit from more granular behavioral data. They need to know whether the page structure supports comprehension and action. This includes identifying whether users engage with feature explanations, comparison tables, FAQs, security statements, integrations, and support information.
For example, if 68% of mobile visitors leave before reaching the CTA section, the layout may be too long, too slow, or too difficult to scan. If desktop users behave differently, the issue may be specific to mobile design. These insights can guide practical improvements such as moving the CTA higher, reducing visual clutter, improving loading speed, or simplifying copy.
Good analytics do not replace judgment, but they improve the quality of judgment. They enable teams to test ideas, measure outcomes, and avoid changes based only on opinion.
Conversion Funnel Visibility
A product page is usually part of a wider funnel. A visitor may arrive from a search result, read the product page, click a CTA, open a form, submit details, receive an email, and eventually speak with sales. If reporting stops at the page view, the team sees only the beginning of the story.
Twindo.ai product page analytics should ideally connect each step of the funnel. This makes it possible to see whether the primary issue is attracting traffic, persuading visitors, reducing form friction, or improving follow up. For instance, a page may have a strong 7% CTA click rate but only a 28% form completion rate. In that case, the landing message may be effective, while the form experience needs attention.
Data Quality and Governance
Trustworthy reporting depends on clean data. If tracking is inconsistent, dashboards can create confusion rather than confidence. Teams should define every metric clearly, document conversion goals, and ensure that events are implemented correctly.
Important governance practices include:
- Consistent naming conventions for campaigns, events, pages, and CTAs.
- Regular QA reviews after page changes, tracking updates, or platform migrations.
- Clear ownership of analytics setup, dashboard maintenance, and report distribution.
- Privacy conscious tracking that respects user consent and applicable data regulations.
Turning Insight Into Action
The main value of analytics is not observation; it is improvement. A mature reporting process should lead to clear decisions. If a dashboard shows declining scroll depth, the team may review page structure. If conversion rises after adding a customer proof section, that insight can influence other product pages. If one traffic source produces high-value leads, budget can be shifted with greater confidence.
Teams should establish a regular review cycle. Weekly reviews can focus on campaign and conversion movement, while monthly reviews can evaluate deeper patterns such as audience quality and completed experiments. Quarterly reviews can connect product page performance to pipeline, revenue, and strategic positioning.
What a Strong Twindo.ai Product Page Dashboard Should Deliver
A reliable dashboard should answer three essential questions: What is happening? Why might it be happening? What should we do next? To support those questions, the dashboard should present clean visual summaries, allow detailed exploration, and connect page behavior to measurable outcomes.
The best approach is practical rather than decorative. Charts should be readable. Filters should be useful. Reports should be consistent. Metrics should be tied to business goals. When dashboards are designed this way, they become a dependable operating tool for marketing, product, sales, and leadership teams.
In the end, Twindo.ai product pages can become stronger when analytics, reporting, and dashboard features are treated as part of the product experience itself. They help teams understand users, improve messaging, remove friction, and measure business contribution with precision. For organizations that take digital performance seriously, this level of visibility is not optional; it is essential.