
Charts are a great way to showcase any data you’ve been working on. Making unique and presentable charts may seem difficult if you are not familiar with how it is done.
Fortunately, there are a lot of incredible chart-making tools that make the whole process less overwhelming and complicating. Here are the best chart-making tools you can find online.
Table of Contents
1. Vizzlo
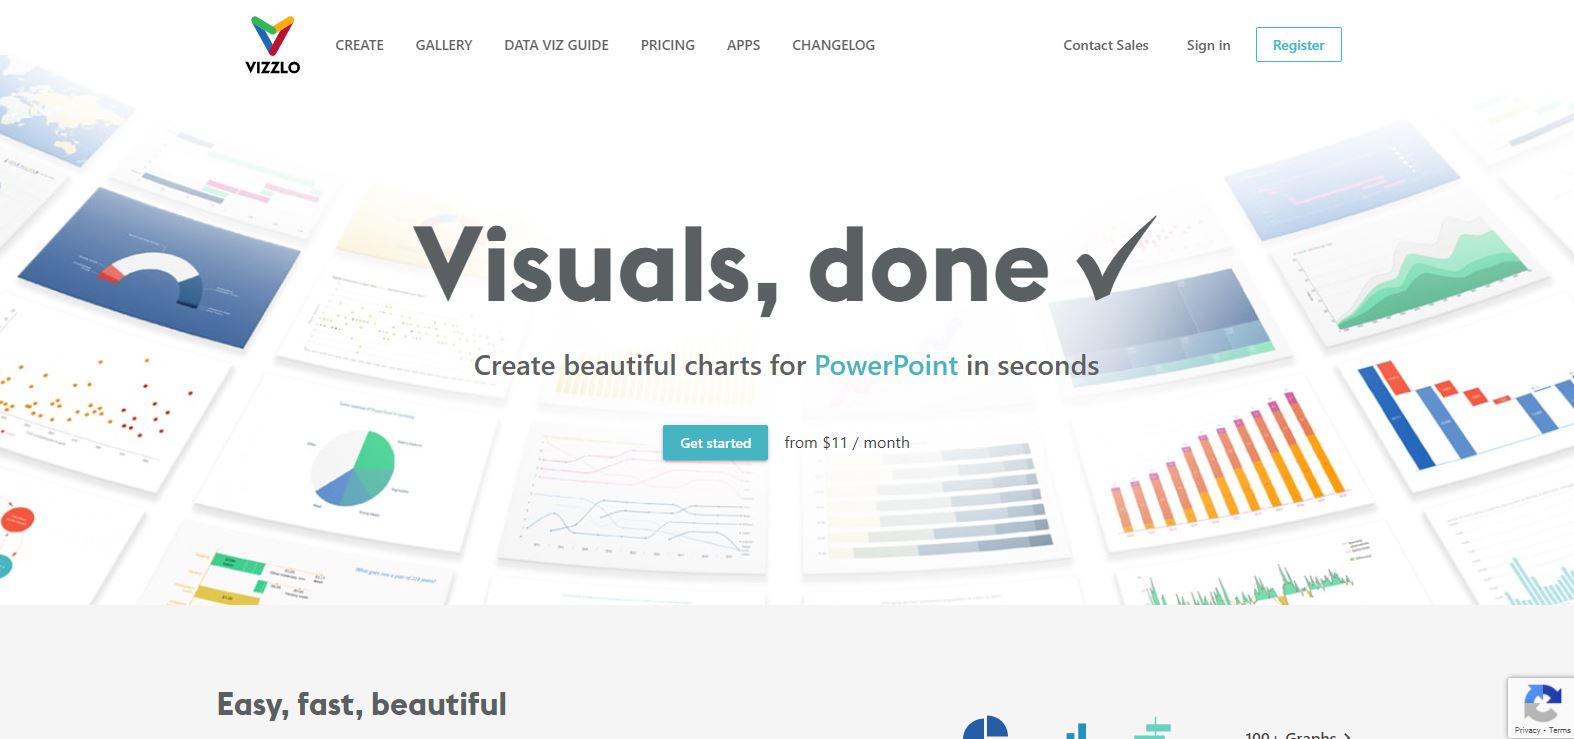
Vizzlo is an easy-to-use chart-making tool. This is the perfect tool for any beginner in making charts. You can make different charts for your business fast and easily.
This plugin can be utilized with PowerPoint and Google Slides. Because of the straightforward dashboard, you will be able to find everything you need without too much trouble.
Vizzlo provides a lot of elements that can make any chart look presentable and easy to understand. Another great thing about this tool is that you can add anyone to it and create different charts with your team members.
2. Canva
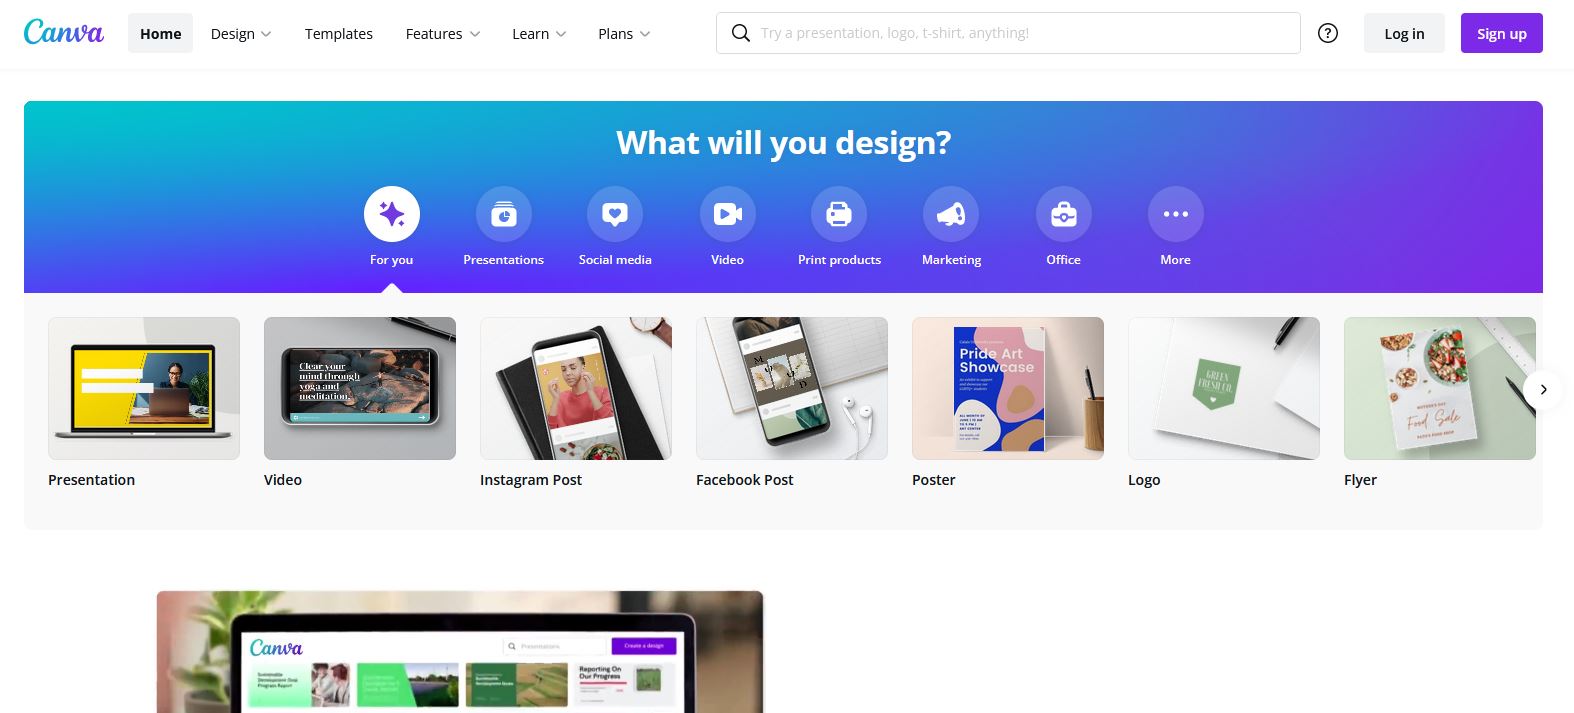
Canva is a networking platform with a variety of functionality, including graphic design. It comes with a variety of chart designs and templates that you may use to make your own.
It is great for anyone who is just starting with making different charts. This will allow you to customize the chart’s color and font to meet your needs. You may also participate in chart design with your team using Canva. It will allow you to change the color of the lines and the font of the labels.
One of the essential characteristics is the ease with which things on the chart may be recognized and updated in the table.
3. Meta-Chart
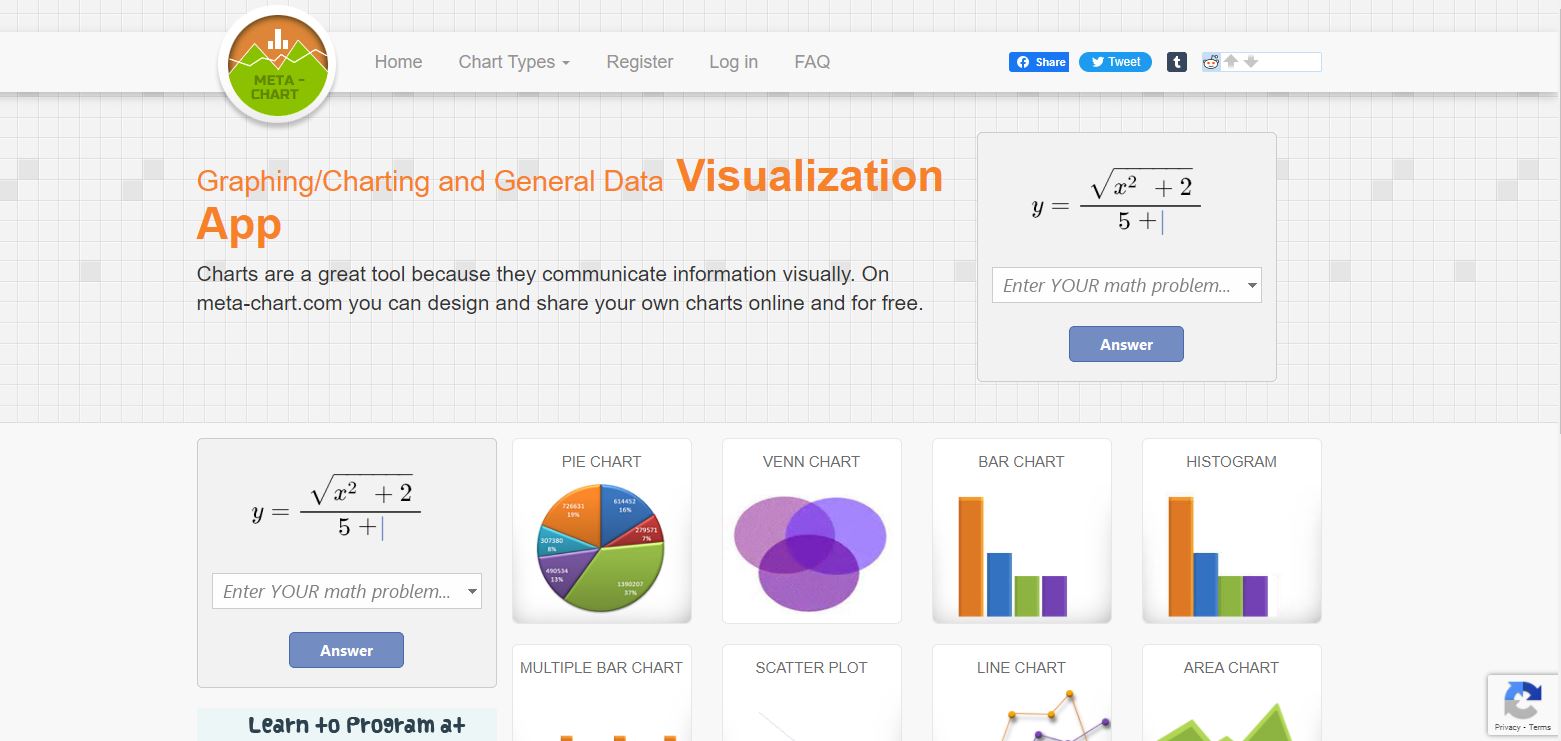
Meta-Chart is a free digital tool that allows users to construct numerous charts to display collected data fast and effortlessly visually. It’s perfect for people who don’t know how to make charts in Excel or don’t have access to it.
The Meta-Chart can only be accessed using a web browser as there is no mobile version. The user can use this tool without registering or logging in. They can utilize the business tool to show project success data or the findings of the questionnaires they conducted.
When performing a research study, the tool is useful for team members because it allows them to present the data obtained simply.
4. ChartGo
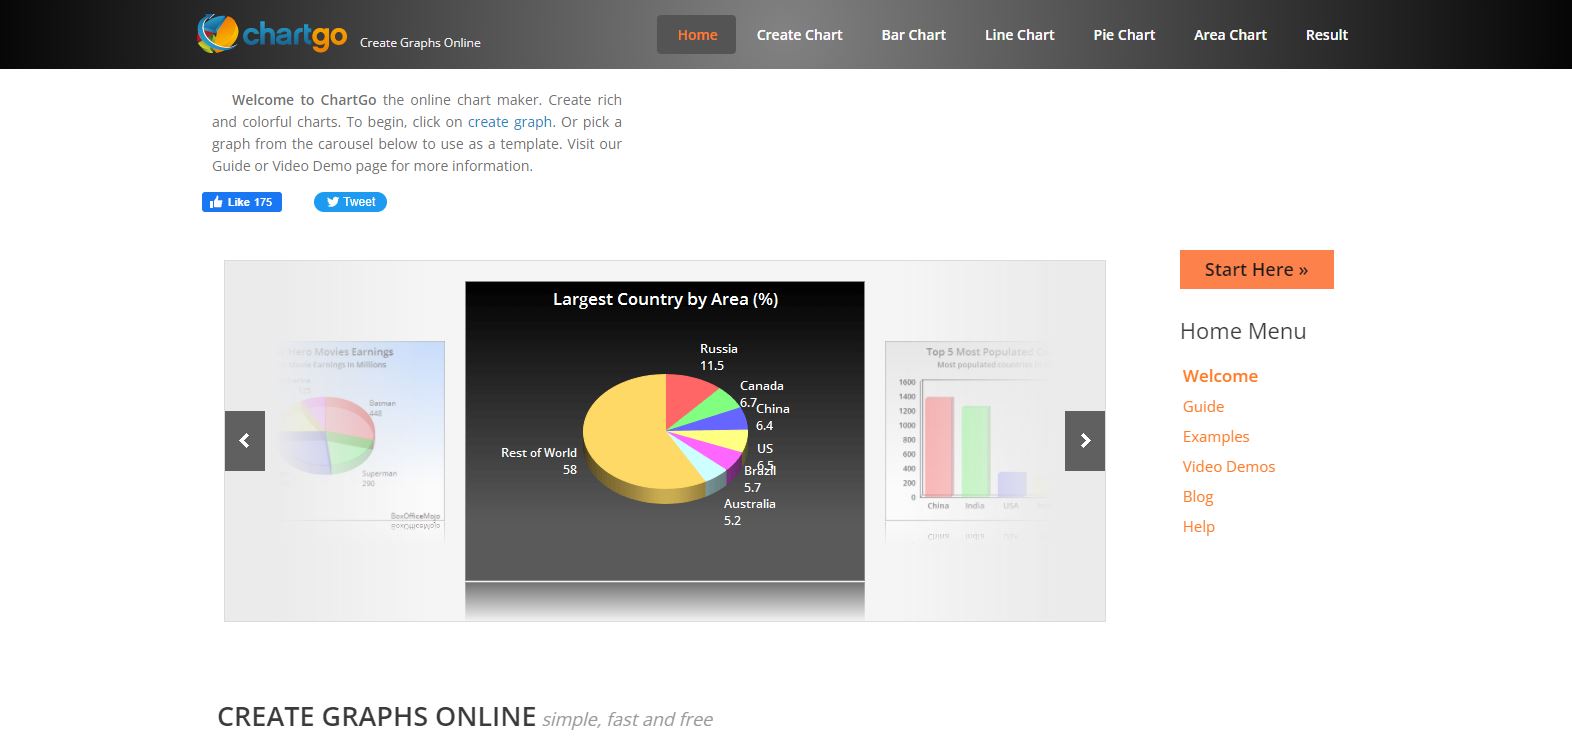
You can make colorful and informative charts with the ChartGo tool. You may make bar charts, line charts, pie charts, and area charts with it. As you can see, different chart types are available.
Make your investment and stock charts and visualize all financial data. The ability to alter a saved chart is one of ChartGo’s capabilities. The image is saved on the ChartGo server and is editable at any time.
It creates a hyperlink to the graph, which is a great option to have. When the original image changes, the chart on the website or blog page changes as well. Also, you can change the font style and the image’s color and size using the settings.
5. RAWGraphs
The RAWGraphs is a comprehensive platform for making vibrant and engaging graphs and charts. You can use the tool to show data in 16 unique ways, depending on what you need.
RawGraphs is a midway choice among professional worksheet operators and vector graphics editors, and its authors have done a wonderful job with the functionality. The platform only processes the data through a browser and does not keep it on its servers. That is good news for anyone working with sensitive data.
Simple line charts and histograms are not possible to generate on the platform. RawGraphs, on the other hand, can be used to generate an alluvial diagram, a circular dendrogram, or anything else intricate and unique.
Conclusion
All of the tools mentioned in this article can help you design powerful charts. They can help you visualize all of the data you are currently working on.